Graph of sales or purchases for a debtor or creditor
An additional button appears at the bottom of the screen in the address file entry grid, on the Debtor and Creditor tabs.
| When you click on this button, the program calculates the monthly sales/purchases amounts and gives you a graphical representation. |
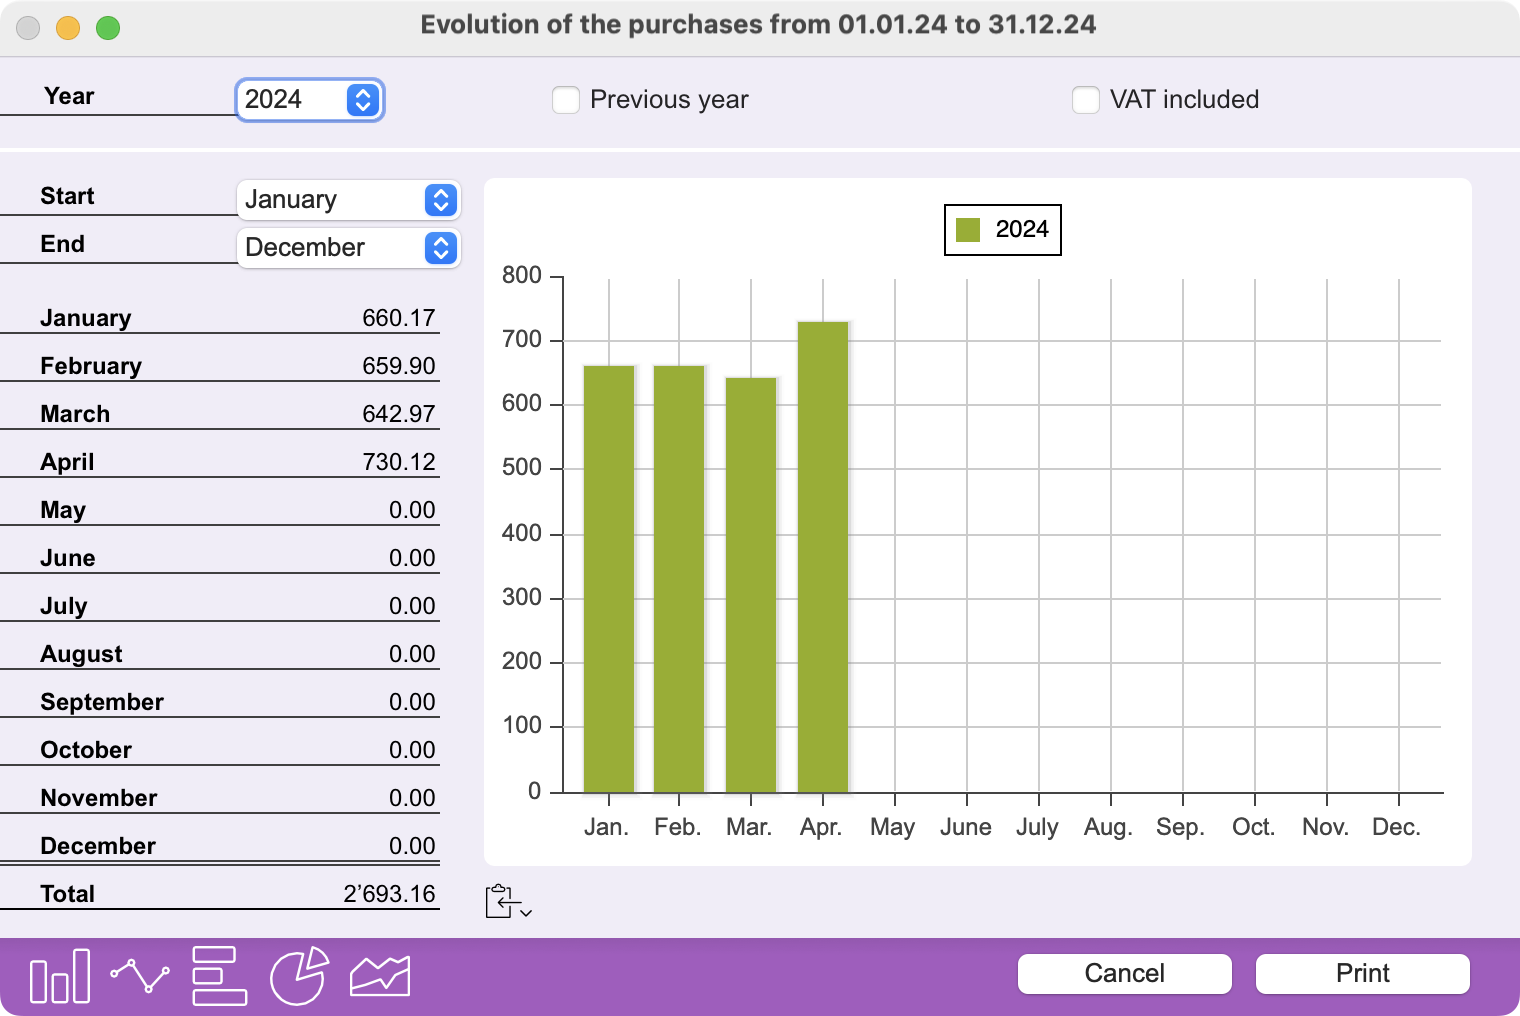 |
The graph is displayed for the period you select using the local menus. It can also display, for comparison, the values for this period in the previous year, by checking the corresponding option. Monthly amounts are calculated and displayed with or without VAT, depending on the status of the VAT included checkbox. |
The buttons at the bottom of the window offer different display modes. You can choose between columns, curves, horizontal bars, sectors and areas.
Copy or save graph
The on-screen graph can be copied to the clipboard, or saved as a file on disk, for insertion in another document, such as an activity report.
You can specify the image format in which you wish to retrieve the graphic. To do this, use the small button with the clipboard icon to the left of the graphic bottom. A long or right click brings up a pop-up menu with a choice of PNG, JPEG or SVG formats, or the Save… command.
Print the graph
Simply click on the Print button at the bottom of the window. Once in the print dialog, you can also request the creation of a PDF file rather than a paper printout.
 Français
 Deutsch
 Italiano